
If you are sitting over there wondering if you have it cut out to write a textbook for your kids, one that they will comprehend, yet be able to push their abilities, there are some tools that might help. I am not a reading expert and I know there are teachers out there who have their reading specialty degree, but there are two tools that help teachers, parents, and students know what materials your students will get the most comprehension out of. As I wrapped up the text for my first chapter, one of the things that I am aware of is what the text’s Lexile and written analysis scores are. Let me show you how to find both.
1. Lexile.com
In order to use Lexile.com, you need to create a free account. Once completed, go to the Lexile Tools heading and pull down Lexile Analyzer. You will need to have your sample of text saved as a .txt file which you can easily do in Word, (File-> Save As). Next, choose the file and hit submit. On the left side of the screen, you will get a Lexile score and some other data. The data that you see is a scoring for an end of the year speech that I gave for one of my student athletes.
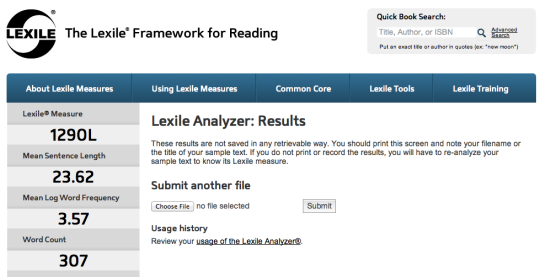
You can see that the Lexile score is 1290L, the average sentence length of my written speech, and how many words in the text. I am more interested in the Lexile score, as the others are more fun facts. But here is what Lexile.com says that it all means.
MetaMetrics® has studied the ranges of Lexile reader measures and Lexile text measures at specific grades in an effort to describe the typical Lexile measures of texts and the typical Lexile measures of students of a given grade level. This information is for descriptive purposes only and should not be interpreted as a prescribed guide about what an appropriate reader measure or text measure should be for a given grade.
The tables below show the middle 50% of reader measures and text measures for each grade. The middle 50% is called the interquartile range (IQR). The lower number in each range marks the 25th percentile of readers or texts and the higher number in each range marks the 75th percentile of readers or texts. It is important to note that 25% of students and texts in the studies had measures below the lower number and 25% had measures above the higher number. Data for the reader measures came from a national sample of students.
Typical Reader Measures, by Grade
| Grade | Reader Measures, Mid-Year 25th percentile to 75th percentile (IQR) |
| 1 | Up to 300L |
| 2 | 140L to 500L |
| 3 | 330L to 700L |
| 4 | 445L to 810L |
| 5 | 565L to 910L |
| 6 | 665L to 1000L |
| 7 | 735L to 1065L |
| 8 | 805L to 1100L |
| 9 | 855L to 1165L |
| 10 | 905L to 1195L |
| 11 and 12 | 940L to 1210L |
Data for the first column of text measures came from a research study designed to examine collections of textbooks designated for specific grades (MetaMetrics, 2009). The “stretch” text measures (defined in 2012 through studies related to the development of the Common Core State Standards for English Language Arts) in the second column represent the demand of text that students should be reading to becollege and career ready by the end of Grade 12.
Thankfully, I wrote my speech above the 12th grade level, but it also means that my high school graduated audience should be able to understand the ‘big’ words that are coming out of my mouth. Lexile.com says once you determine the Lexile score of your audience, that you can push the range 50 pts above, but should not be more than 100 pts below. It does make writing for a certain audience more difficult, but you can wow your Amazon and iBook buyers, parents, and teachers by providing a Lexile score showing that some thought went into writing your text for a particular audience. Below is a video about Lexile scoring and what it all means.
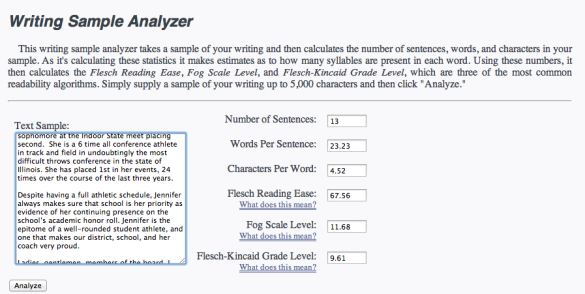
2) The second tool that I use is much more accessible to the public and I have used it a lot already in my classes. A data analyst and consulting group wrote the script for a writing sample analyzer. In the creator’s words:
Most notably, I wrote a Writing Sample Analyzer, which predicts reading ease based on Flesch, Fog and Flesch-Kincaid approximations. The Analyzer receives approximately one hundred hits a day, and was donated to the Logan Utah Public Library for their Adult Literacy Group. I also do volunteer website design and development for other organizations when I have time.
Basically, I have used the analyzer to show kids what grade level they are writing at. My students write eight essays over the course of the school year and the kids type their corrections. Every now and again, I have the kids copy and paste the text into the query box and hit submit to see the results. The kids like it because it is interactive, personal, and not meant to be a permanent score. Kids immediately want to know what they can do to raise their “write-ability” score. We read through the meanings of each of the analyzer’s indicators and I also make sure to discuss that just because they raise their write-ability score, it does not look at content. (Neither does Lexile.com for that matter).
Here is what the website says the above categories mean:
The Flesch Reading Ease Scale:
The Flesch score relies on the number of syllables and sentence lengths to determine the reading ease of the sample. 20 words per sentence with 1.5 syllables per word yields a Flesch score of 60 and is taken to be plain English. A score in the range of 60-70 corresponds to 8th/9th grade English level. A score between 50 and 60 corresponds to a 10th/12th grade level. Below 30 is college graduate level. To give you a feel for what the different levels are like, most states require scores from 40 to 50 for insurance documents.
The Fog scale is similar to the Flesch scale in that it uses syllable counts and sentence length. The scale uses the percentage of ‘Foggy’ words, those that contain 3 or more syllables.
A fog score of 5 is readable, 10 is hard, 15 is difficult, and 20 is very difficult.
The Flesch-Kincaid Grade Level :
The Flesch-Kincaid Grade Level heuristic indicates that the average student in the grade level produced by the scale can read the text.
————————-
It actually seems that the second analyzer is more critical of my writing and tells me that I write for a 9th grader’s comprehension. I do not know the exact science and calculations that go into creating these bots, though I do remember trying to figure out the readability of a text by hand when taking one of my college teaching courses. If you want to find out more about the script itself, you can read her FAQ here. Thank God there is a bot for this now. Just remember to tell the kids to write out numbers and that if they have bulleted information such as A), B), 3., etc. that they should change this before running the bot since it will calculate these as words and you don’t want a whole bunch of one letter words calculated into your final score. It is one thing that I am finding difficult as I write, since my illustrated comic guide includes short retorts, ideas that are written as fragmented sentences, and lists.
In summary, I know that Microsoft Word also tells you a couple of basic statistics, but I think people are really interested in the Lexile score if you are going to publish a textbook. I think that I write pretty well, but I am not a professed master with the written word, so I use these tools to help guide me through my process. Use the writing analysis for the kids in class. It is iPad friendly and the kids get a kick out of editing their text quickly to better their score.
Oh brother, I wrote this post fora 7th grader, back to the drawing board…

Leave a Reply